Classroom experiments are a great way to communicate insights and R/shiny is a fantastic tool to develop interactive data displays. Linking the two together, you can build a unique experience for your students! Recently, I used a shiny app to run a classroom experiment in the first class of my introductory cost accounting course. I uploaded code, data and materials to Github so that everybody can reuse it to construct similar experiments and, of course, to replicate the results from our experiment.
The experiment tests whether cost allocation (variable cost or full cost) affects pricing decisions in a simple one product pricing setting.
This is the experimental treatment with variable cost information.
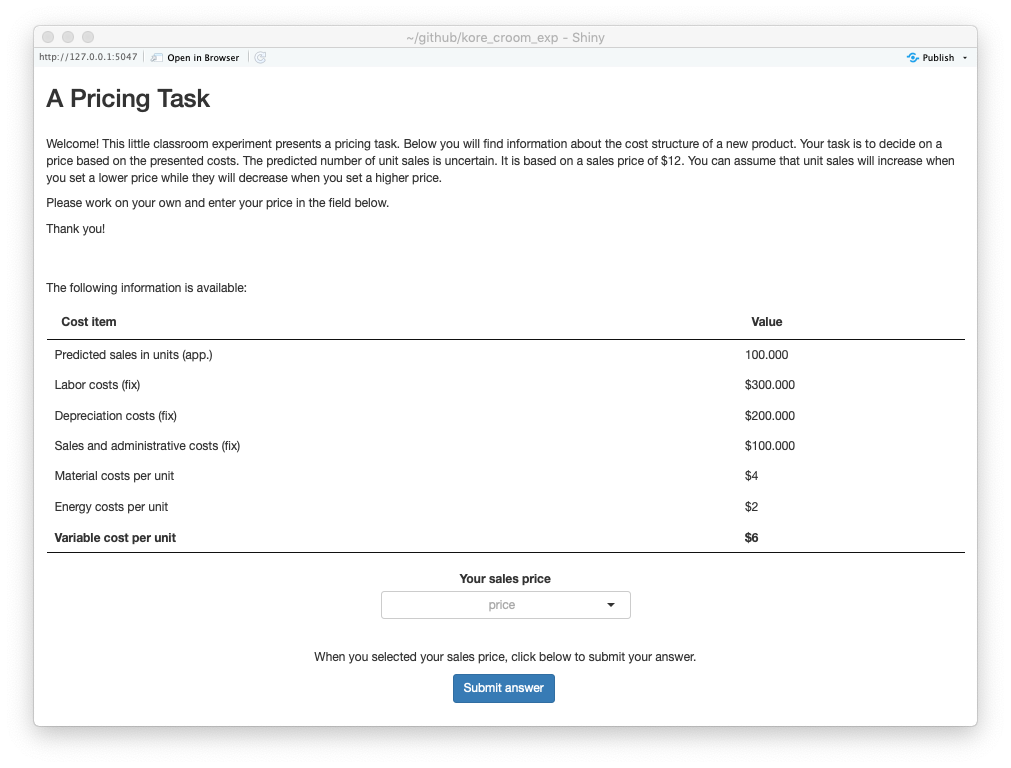
And this is the treatment with full cost information.
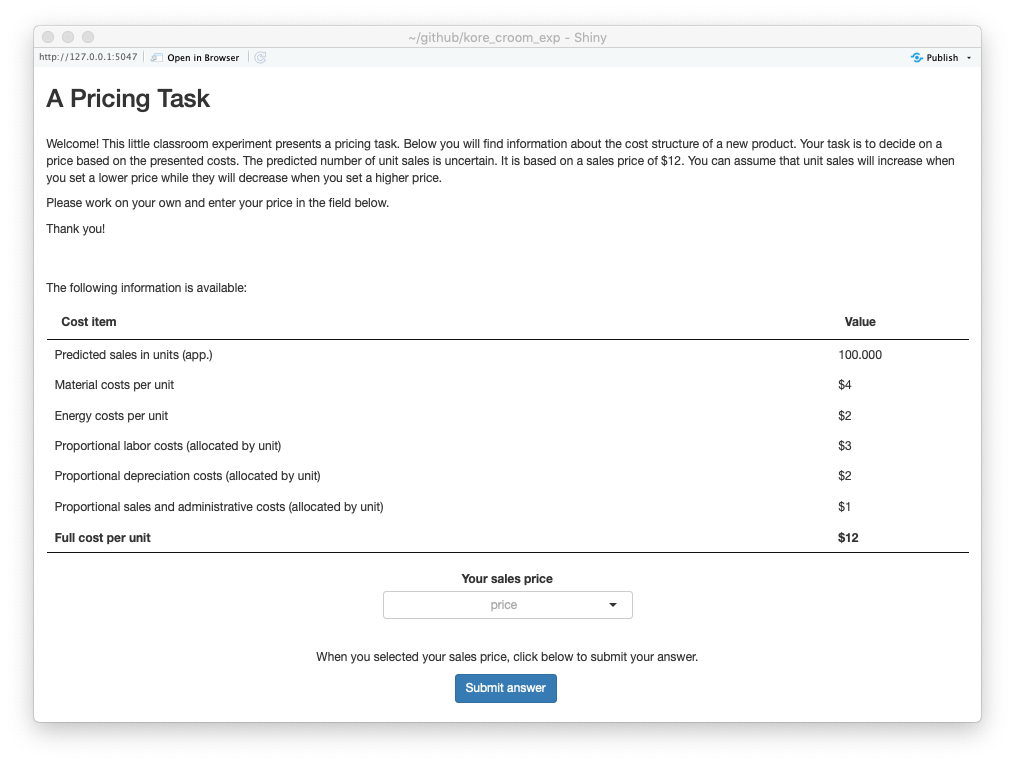
In principle, both formats provide the same underlying information and thus, pricing should not differ across the two treatments if subjects rationally extract all available information.
Under the full cost treatment, however, fix costs are being allocated to units based on expected unit sales. Assuming that students use simple “cost plus” heuristics when setting their prices, this could imply that they are less likely to set prices below $12 when receiving the full cost treatment. Note that setting prices below $12 might very well be rational when demand elasticity is large as the increased unit sales can compensate for the loss in margin.
These are the results from our experimental run as presented by the real-time shiny result app:
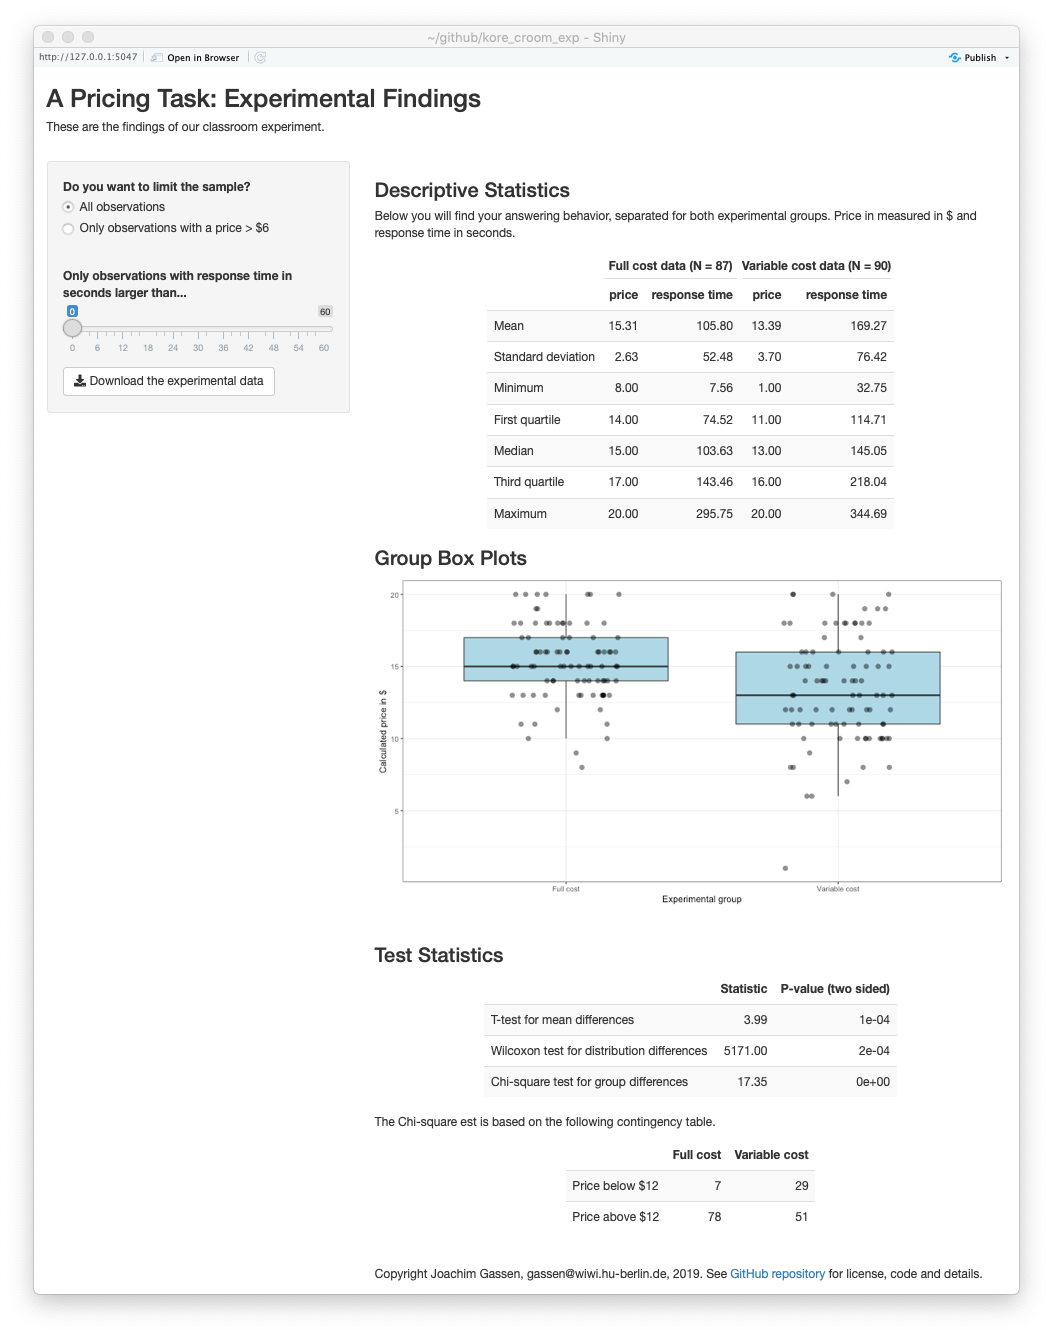
You can assess the online version of our results here. It was fun to present the students with the findings of the experiment right after they finalized their online answers. As you can see, for our students it seems as if, in line with some prior literature, full cost accounting causes them to set higher prices. In real life, this might imply the risk of losing market share, eventually pricing oneself out of the market.
Obviously, this finding might be an artefact of me using relatively inexperienced students that only had one prior financial accounting class as subjects. Also, it can be driven by the wording of the treatments (e.g., I did not use the term ‘fixed cost’ in the full cost treatment). This is why it would be insightful if people could replicate the findings from my class in classes with more experienced students and/or based on refined treatments.
Replicating the analysis and reusing the code
The Github repository contains the data from our analysis as well as all the code that you need to set up the experiment on your own shiny server. I have included the English language version along with the original German language version that I ran in class.
Setting up your own shiny server is not as hard as it might sound (for starters, see here and here). If you want to re-run the experiment in your class for didactical purposes and/or to replicate our findings, you can also reach out and I can provide you links to our shiny server at Humboldt so that you can run the experiment with your students.
If you want to use the code as a starting point for your own classroom experiments, the Github repository contains some additional info about the code. In any case, I would be very happy to get in touch if you are reusing the code for your own projects. In particular, I would be interested in hearing about people that (want to) replicate our experimental classroom result. Feel free to comment below. Alternatively, you can reach me via email or twitter.
Enjoy!